JsPspEmu: Tools for debugging the emulator
PSPEMU
May 18, 2014
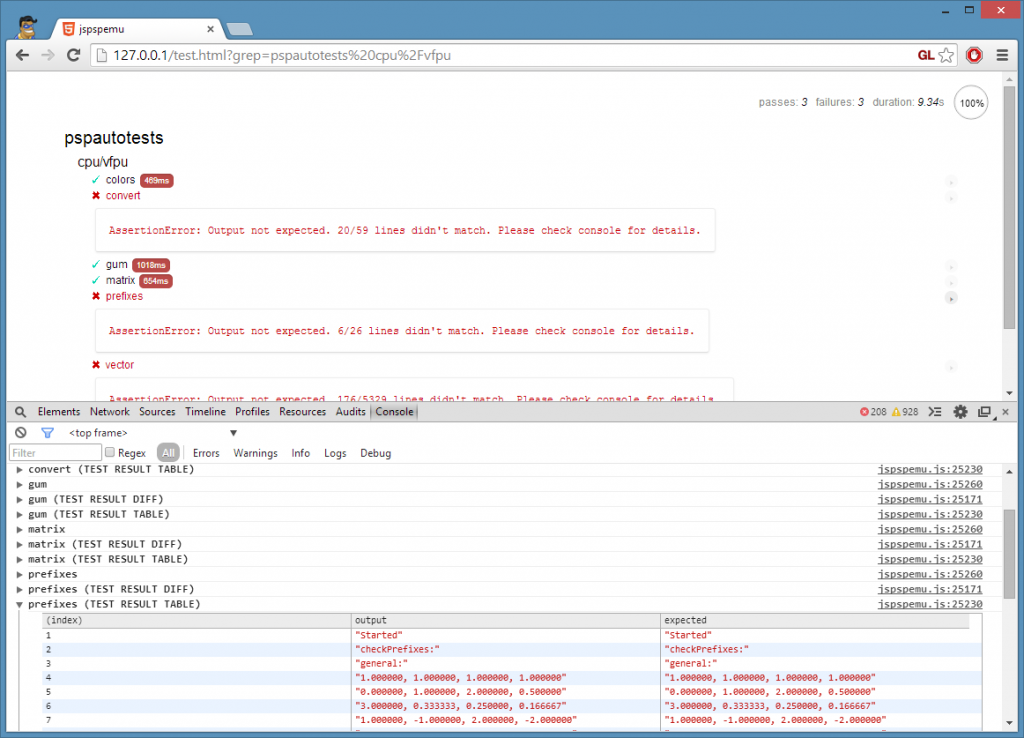
While developing the emulator I needed to debug stuff. Besides the pspautotests project that allowed me to verify some behaviours, I need to stop the execution of the emulator in several places, and to trace stuff. Also I needed to debug webgl and to detect which parts of the emulator to optimize.
The simplest way of debugging:
console.log(), console.warn(), console.error()
Collapsable groups and tables, helped a lot for testing:
console.groupCollapsed(), console.table()
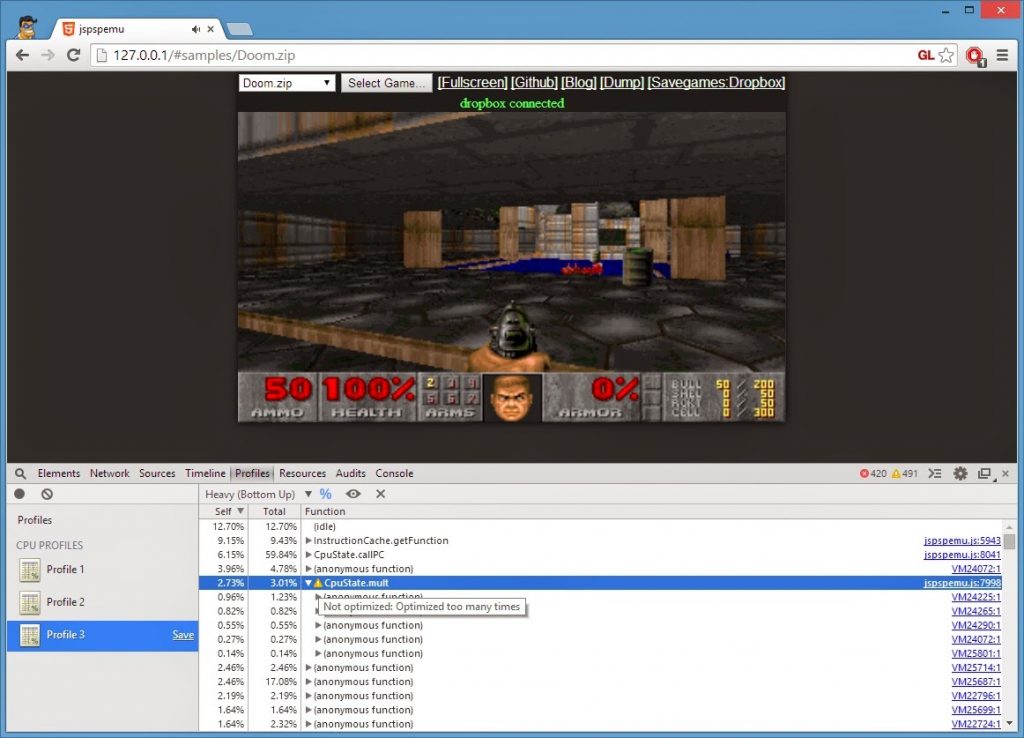
Chrome’s profiler helped a lot in determining slow functions:
Stopping the execution in some conditions:
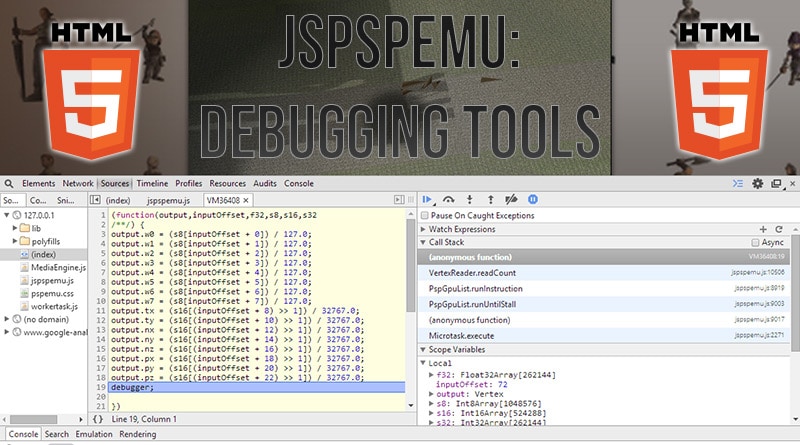
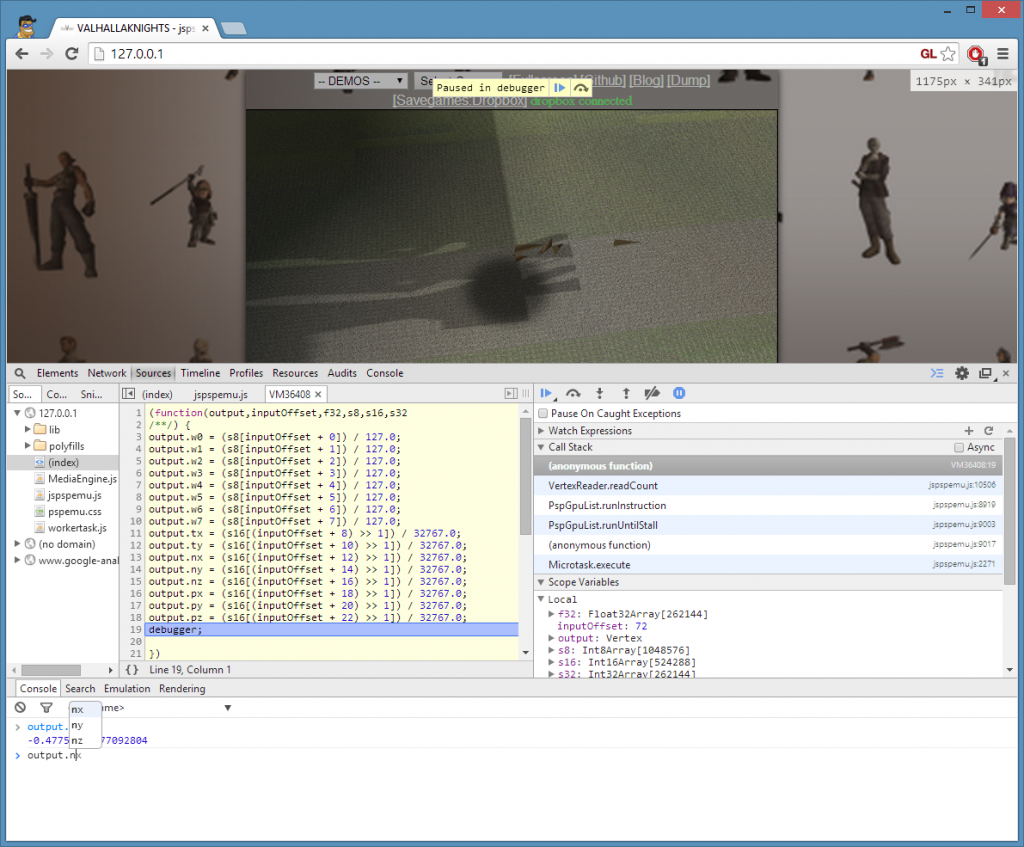
The debugger;* keyword* (that I didn’t know before starting the emulator) helped was a very valuable tool that allowed me to determine some problems. I was able to use that keyword in functions I made, but also in generated code; that includes CPU generated functions, and vertex decoding. Also browsers have a console, that allows you to execute code and view internals, while debugging or while running. So I was able to call stuff like “emulator.threadManager.threads.elements” or evaluate expressions while in a breakpoint.
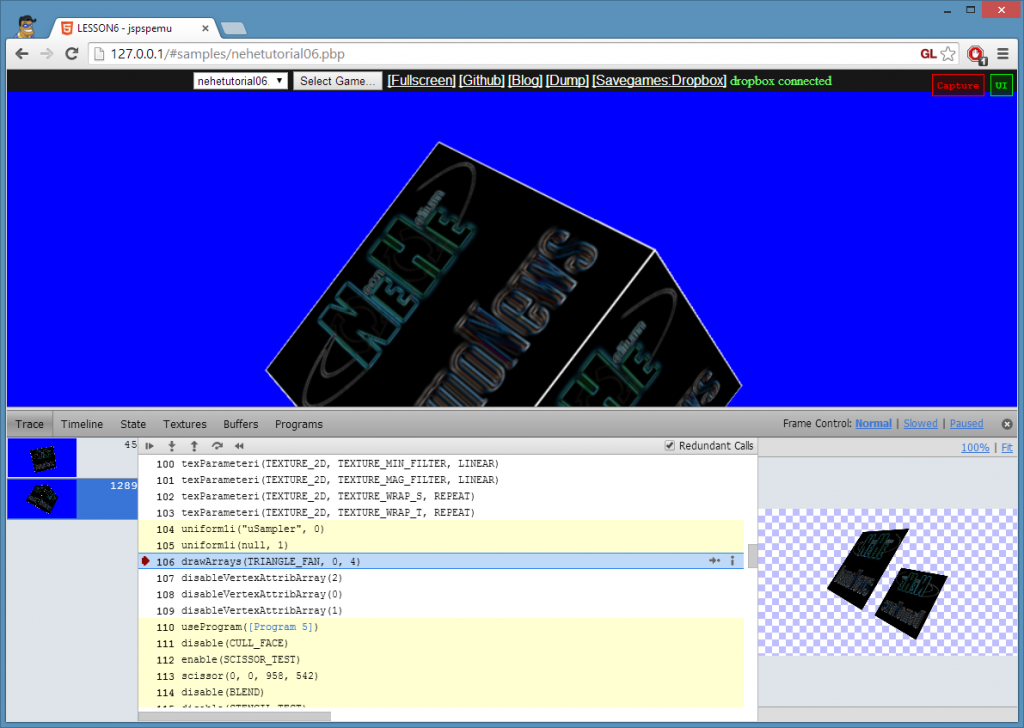
And for debugging webgl, there was a very useful project: WebGL Inspector.
Comments
Comments are powered by GitHub via utteranc.es.