Profile Kotlin-Native on Windows
KOTLIN
March 5, 2021

On MacOS you can use the Instruments application to profile a native application. With debug information you can
check the hot methods and determine places to optimize.
But what about Windows? I checked a few free options to profile .exe files on Windows.
Visual Studio 2019
In the end I saw that Visual Studio provides a way to profile executables. There are several versions here: https://visualstudio.microsoft.com/downloads/
In my case Visual Studio 2019 Community was enough for my case.
When installing you have to select the C++ SDK.
Profiling
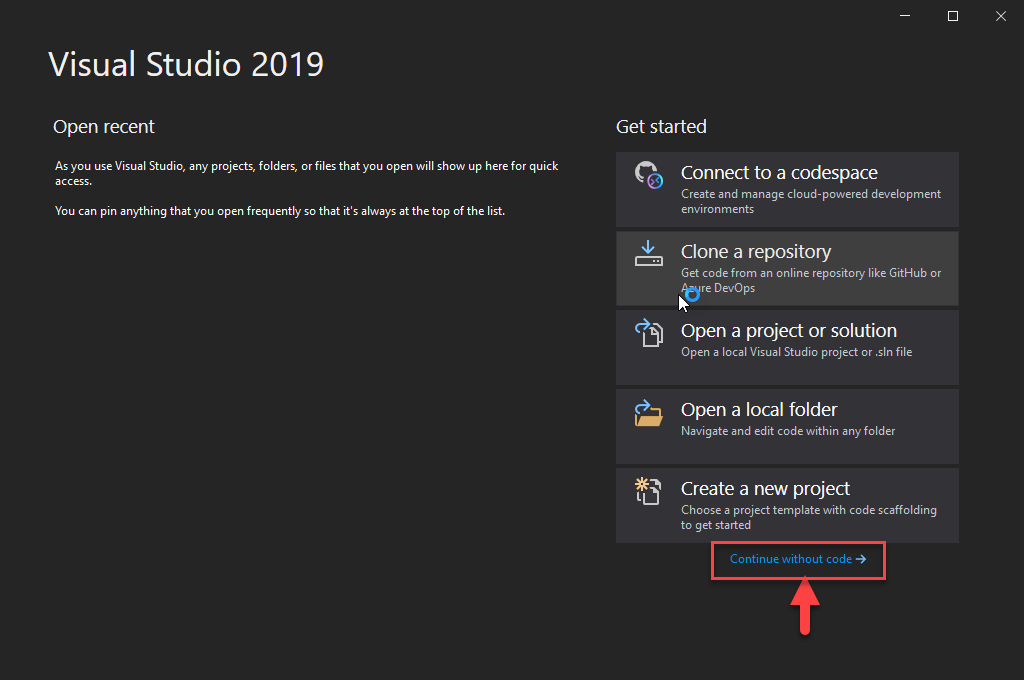
Once Visual Studio 2019 is installed, now we can open it. And click on Continue without code:
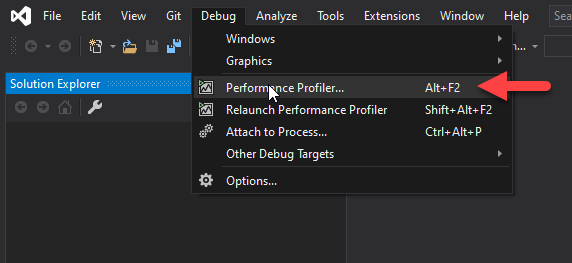
After that: Debug -> Performance Profiler...:
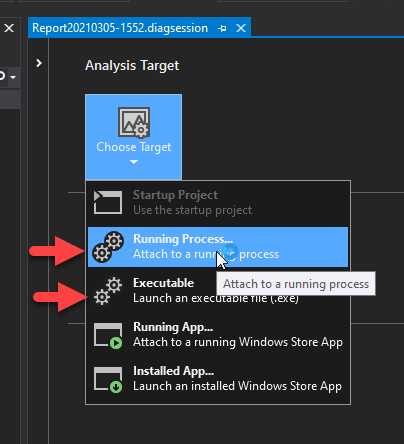
Then we select either a Running Process... or an Executable to profile from the start of the app:
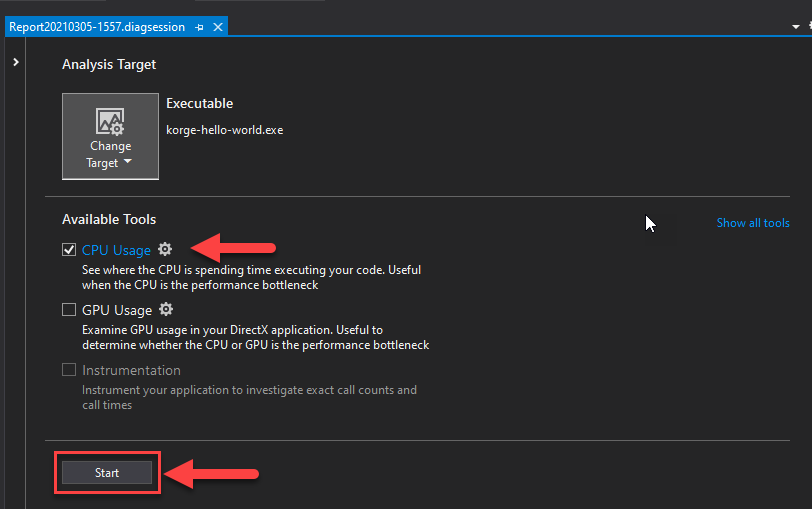
After that we select CPU Usage and click on the Start button:
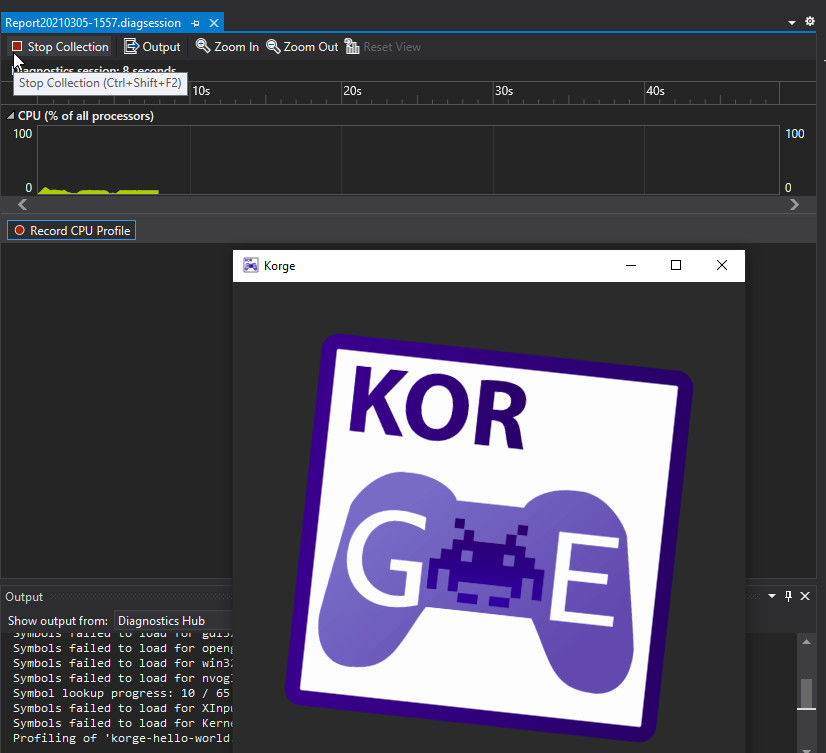
This will start recording the CPU Usage:
And now we have some results:
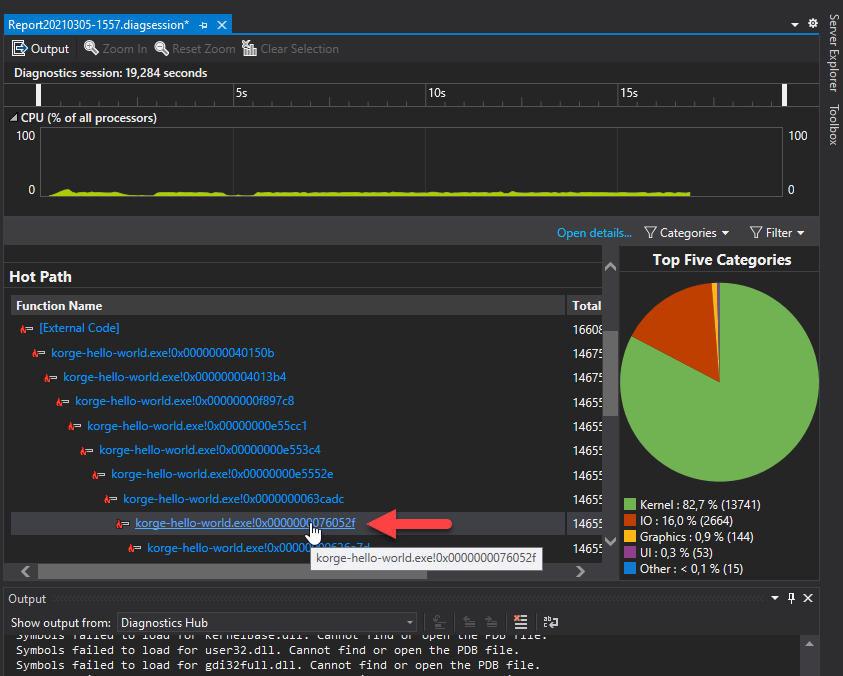
What! This stuff is totally unuseful. No names at all, so can't use this information.
PDB
It seems that Kotlin/Native generated executables embed debug information in DWARF format. Some tools like IDA
Disassembler support this directly. But visual studio requires a separate PDB file that contains debug information.
Now what?
There is a tool called cv2pdb that extracts that embedded DWARF information into a separate PDB file. That tool was created for the D programming language, but somehow also works for Kotlin/Native.
I have uploaded an old precompiled version here: https://github.com/korlibs/korge-tools/releases/download/binaries/cv2pdb.exe
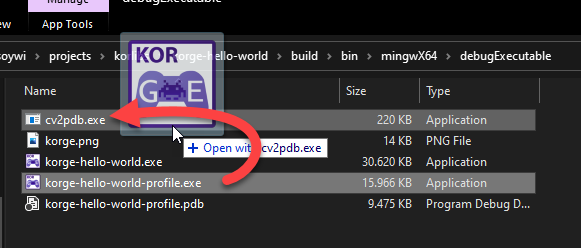
This tool modify the executable stripping the DWARF information by default, so I suggest you to duplicate the
executable. Then you can call the cv2pdb.exe tool via terminal, or just dragging your executable into cv2pdb.exe:
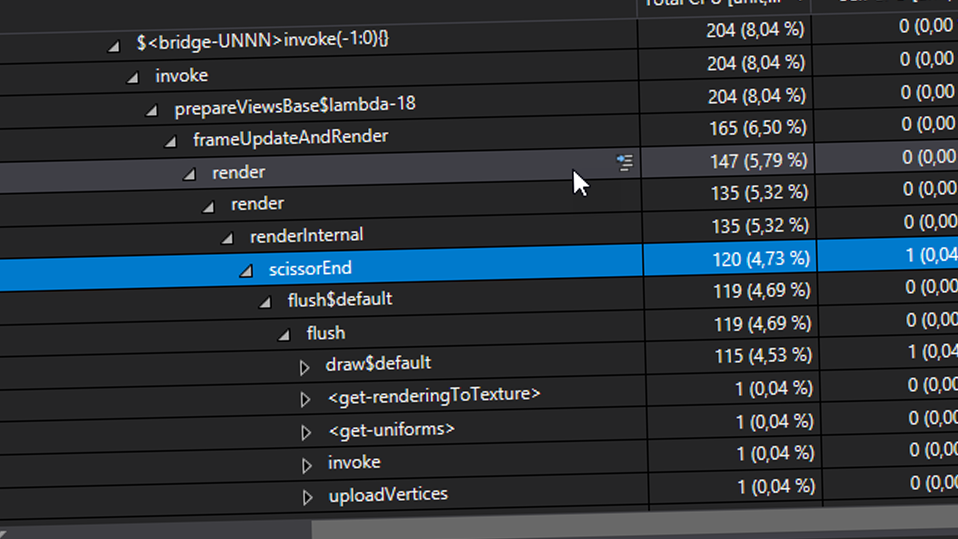
If you perform the other steps again, now you will check that there are function names available (no class in this case sorry), but at least now it is much easier to figure out things:
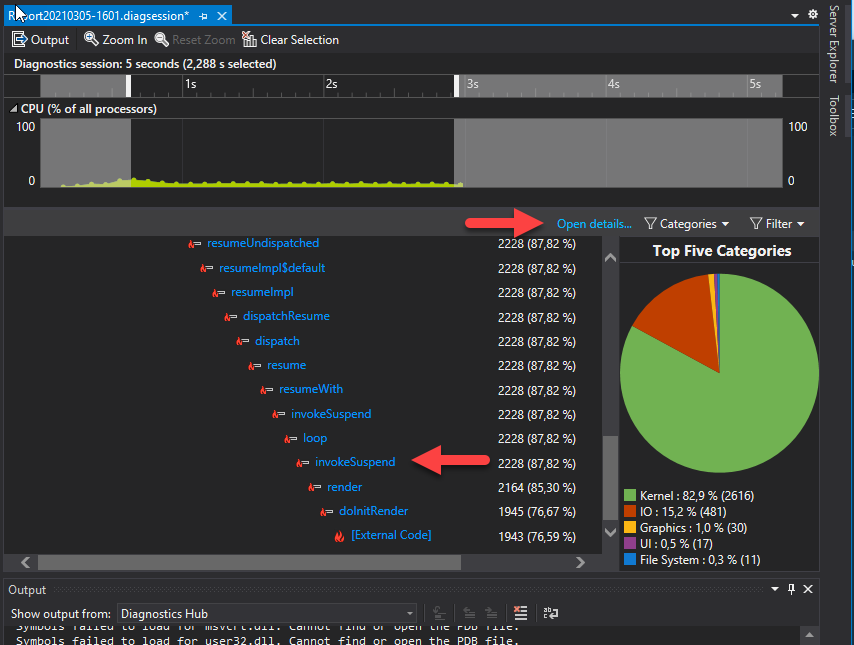
After clicking on any entry or Open details... you can see a typical tree with Total time + Self time for each
method. And that's exactly what I needed!
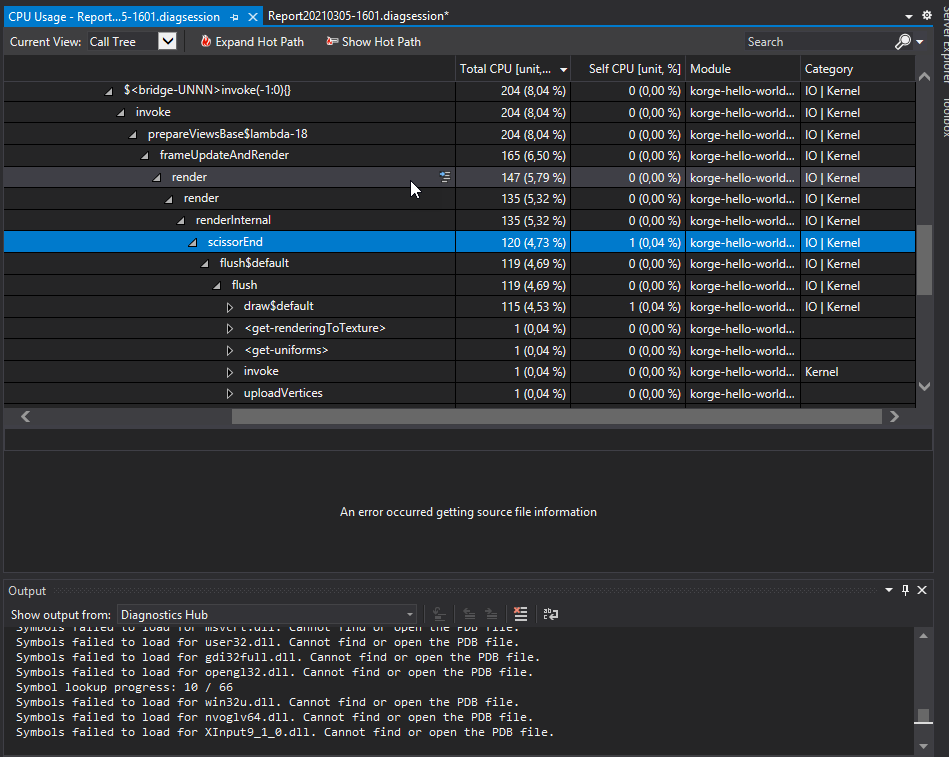
In some cases I was able to get source file information. But it doesn't works always not sure why.
Comments
Comments are powered by GitHub via utteranc.es.