KPspEmu for native Windows and Mac with Kotlin/Native 0.9
PSPEMU KORLIBS KOTLIN KORGE
September 5, 2018
Yesterday, Kotlin-Native 0.9 was released. And I migrated korlibs, and this time kpspemu too. And now it works. And that's a great thing. Kotlin/Native is now pretty stable and have fixed tons of bugs until reaching here.
Note that right now it is slow for certain use-cases like emulators (without making the code more complex), but it is fast enough for other use-cases. You can expect improvements in this area probably after 1.0 is released.
In this specific case it is between one and two orders of magnitude slower than Java. In this post I'm going to talk about the performance issues I have found in 0.9.
Download preview for Windows & Macos with a few homebrew samples (14.4 MB)
Download preview for Windows & Macos (14.4 MB)
And BTW I have compiled both Mac and Windows versions it in a Mac. If you wonder how, here is how.
KPspEmu is a Kotlin PSP Emulator I started sometime ago targeting JS and JVM using korlibs. Is it far far from usable to play games at this point. But the point doing it was to learn and to experiment. I already did a D interpreted version, and a C# version and TypeScript version both with dynamic recompilation. You can read about that journey here: https://soywiz.com/tag/pspemu/
It features multiplatform support. Initially JVM and JS, and now Native supporting all the targets that korge supports.
Also features an initial multiplatform dynarek in addition to its interpreter. The dynarek project allows to generate an AST, and to generate JavasScript when targeting JS, and JVM bytecode when targeting Java. Also supports an interpreted mode for other targets as fallback, but it is even slower than interpreting the PSP right now. The idea is to generate at least X64 and ARM code later for Native.
Performance
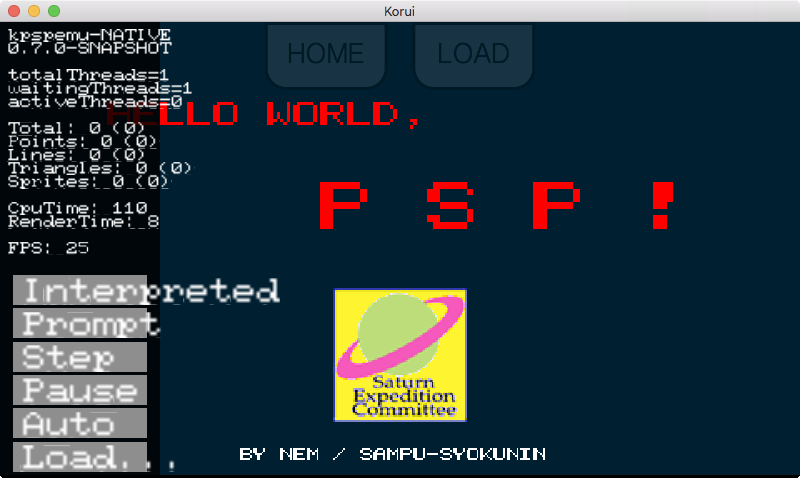
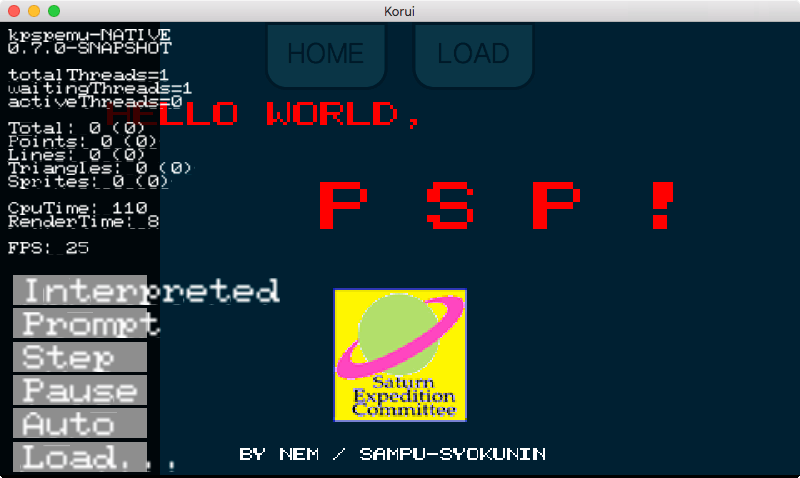
When I was able to to run the emulator with native the first time. The minifire demo, was running at 0,3fps while in JVM reached 60fps without any problems even in interpreted mode. I was able to get it working at 5fps. But without major refactoring making the code uglier wouldn't get better performance. So I will just wait for some stuff.
Exceptions
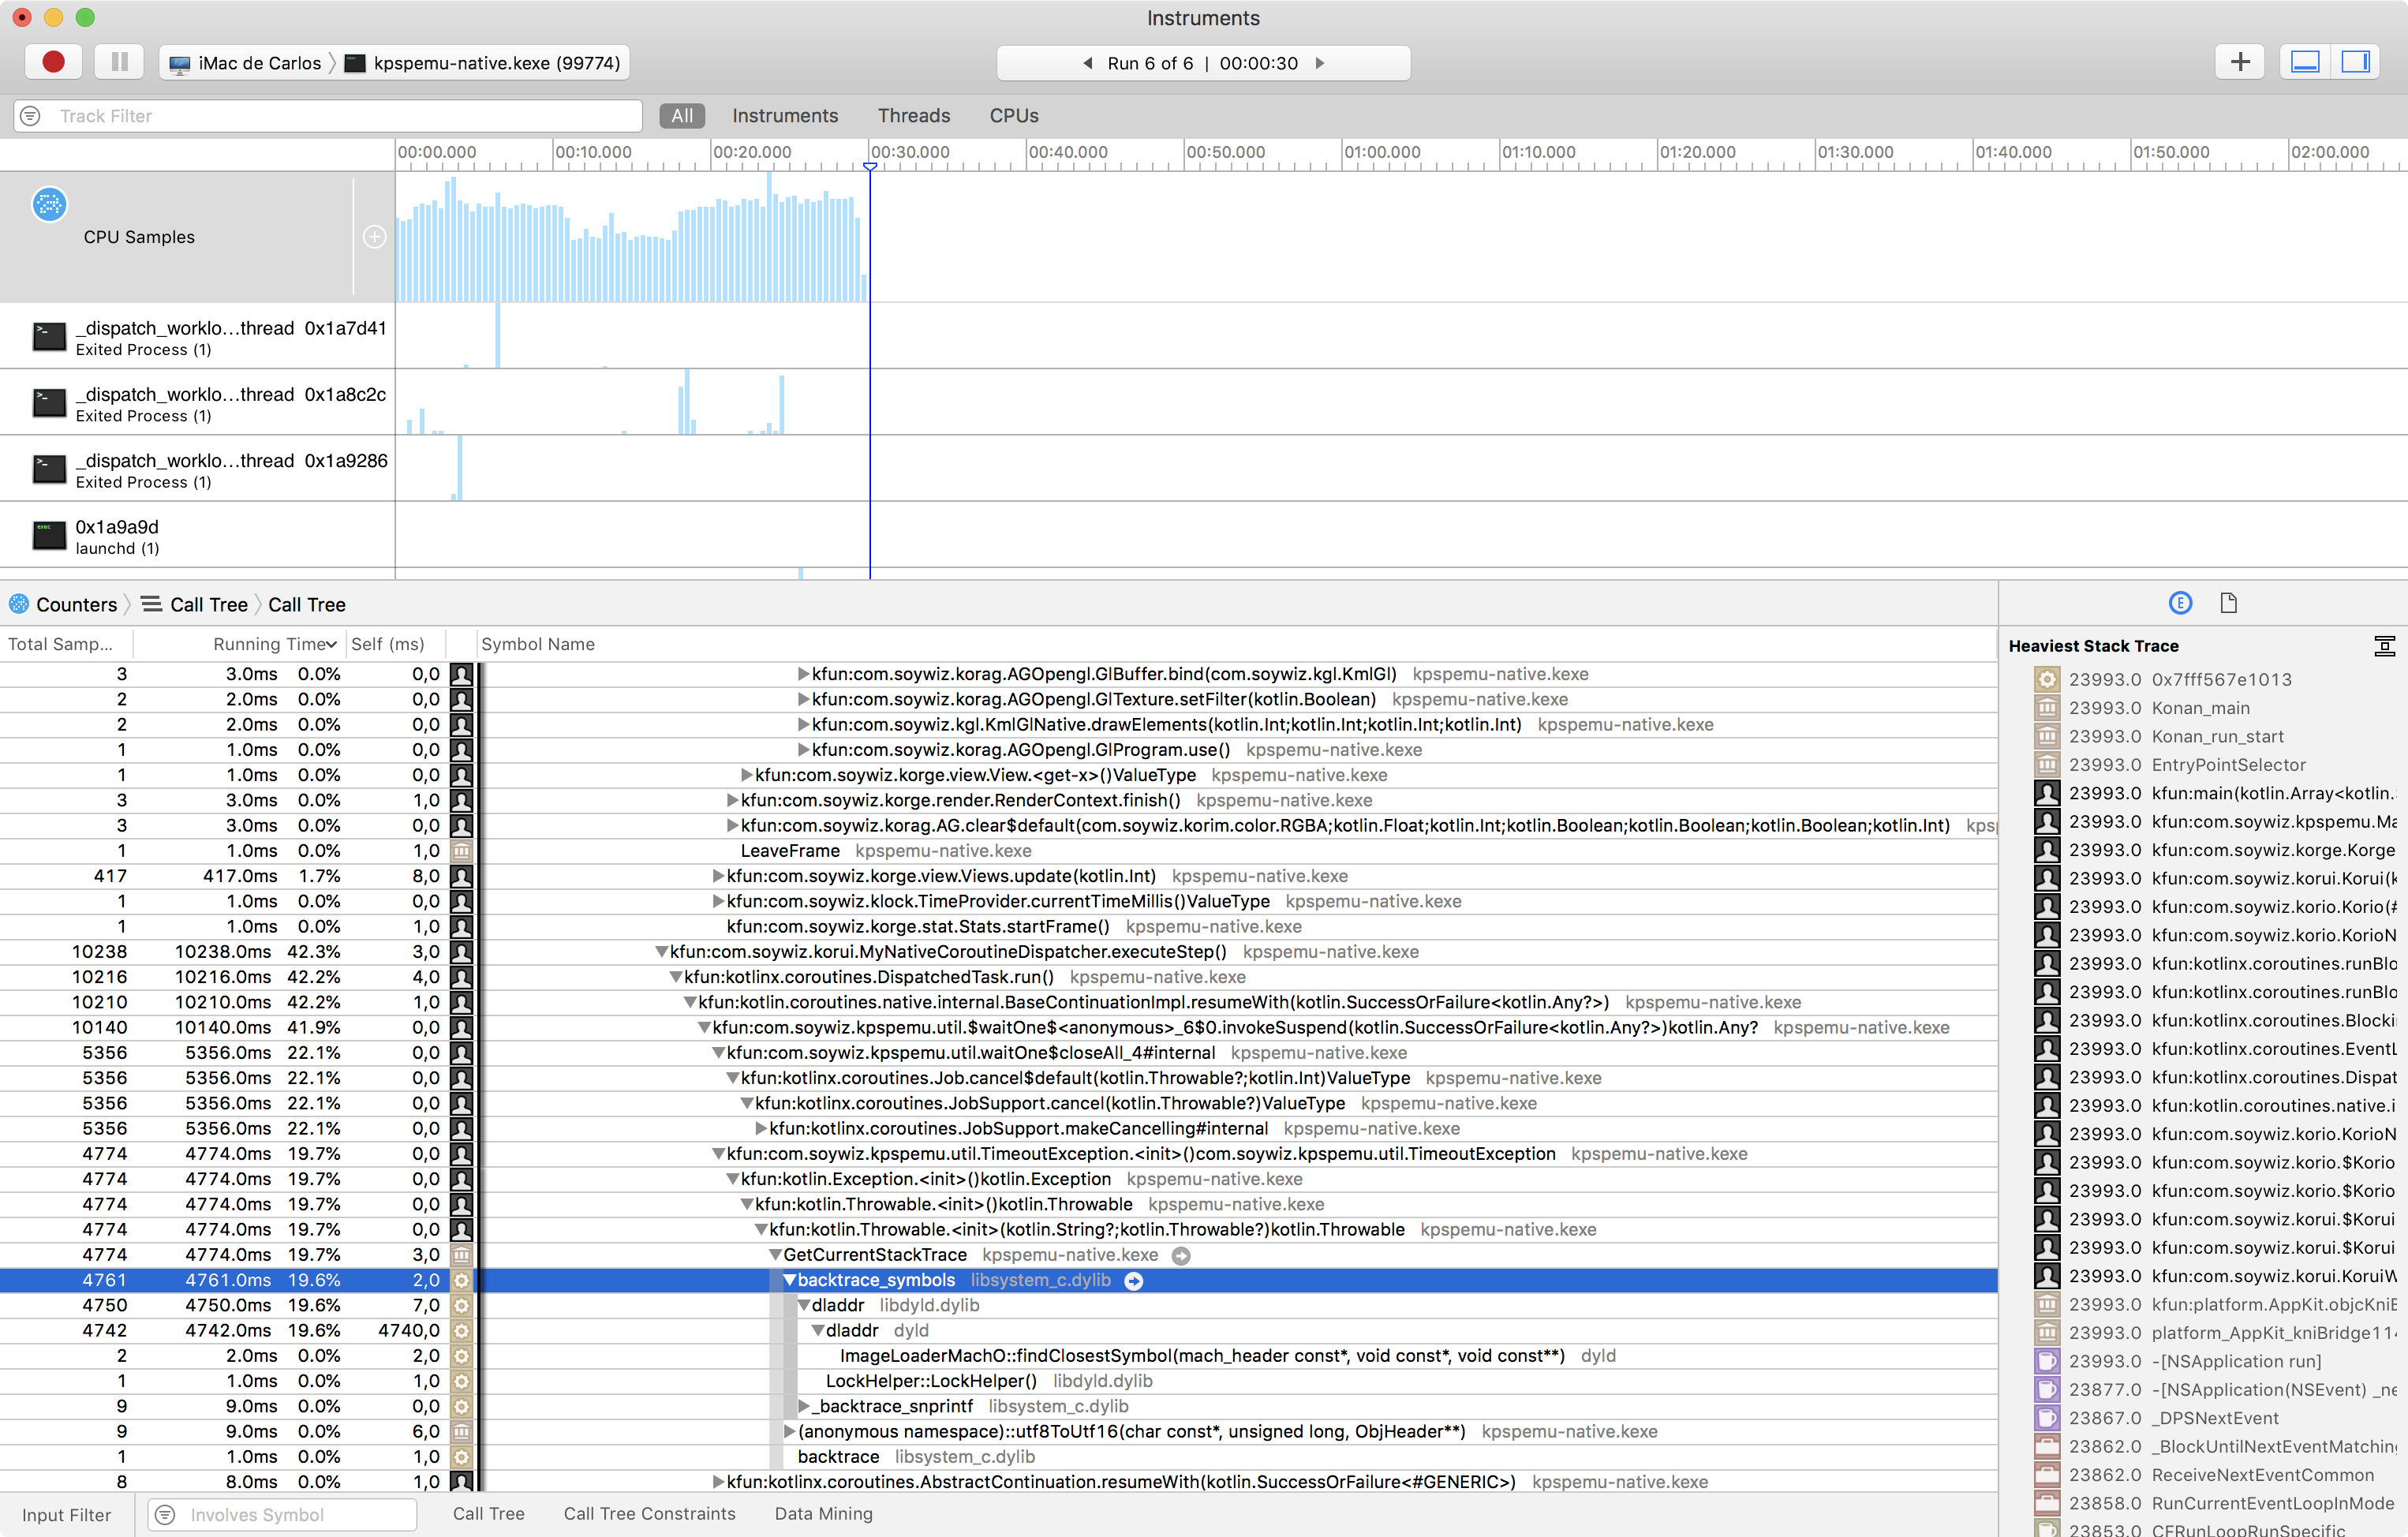
After using Apple's Instruments with Counters, I started to see why it was so slow. One of the reasons were exceptions:
I was launching a lot of exceptions, since I had a mechanism to wait for a Signal with a timeout when the timeout triggered it cancelled a coroutine Job. But I was doing this a lot of times. In JVM and JS instantiation a exception is super cheap. But with K/N is super expensive. It is because it calls the backtrace_symbols C function, that seems to get the stacktrace information even if you don't need it. Probably would be enough to get a list of pointers to functions from the stack, without resolving them. And resolve them lazily if you happen to ever print the stacktrace that was not the case. Not sure if calling backtrace instead and then manually calling dladdr when required would work. But right now it is expensive.
In this case I was able to change the waiting with timeout, to return a nullable type instead of throwing, and was able to remove all those exceptions.
As a hack I could try to create a singleton of an instance instead and throw that. But was not required.
This problem will arise again when I implement dynarek for Native, since I throw exceptions to stop the flow. I create functions that call other functions, but to be portable, whenever an interrupt occurs I have to collapse all the stack I have created. I could reuse the trampolines to return to the thread scheduler, but that would have an overhead too. So for my wishlist post 1.0: faster exception instantiation, throwing and catching :)
Dynamic dispatch
Initially I thought it was one of the performance problems I had. Since I have a Memory class with several subclasses: one with fast memory, other with tracing memory or supporting breakpoints.
So I discarded fancy memories for debugging and make a single final Memory class with all final methods.
But then I noticed that the performance was not much better.
Bound checking and freeze checking
As I stated in other post, when executing a function billions of times per second, every single overhead is a big overhead. The freeze checking is pointless for release-production builds. If you have already tested it and it has no freeze issues. This is a pointless overhead you have everywhere and that also prevents some optimizations like auto-vectorization.
For boundchecking. It can be improved, but it works in some cases. But in my specific case it doesn't work. For example:
I have a fixed:
val GPR = IntArray(32)
Then in other place, I have:
GPR[(IR ushr 0) and 0x1F]
LLVM should know that the indexer is a value between 0-31. If it knows the length of the array, it should work. Maybe the assume intrinsic can help here (provide a function to call the assume intrinsic with Kotlin/Native would also help):
- https://docs.microsoft.com/en-us/cpp/intrinsics/assume?view=vs-2017
- https://clang.llvm.org/docs/LanguageExtensions.html#id15
For me disabling freeze checking is pretty important. Disable boundchecking would be another nice thing to add but less important if this works well, and the boundchecking goes outside loops or totally removed for most use cases.
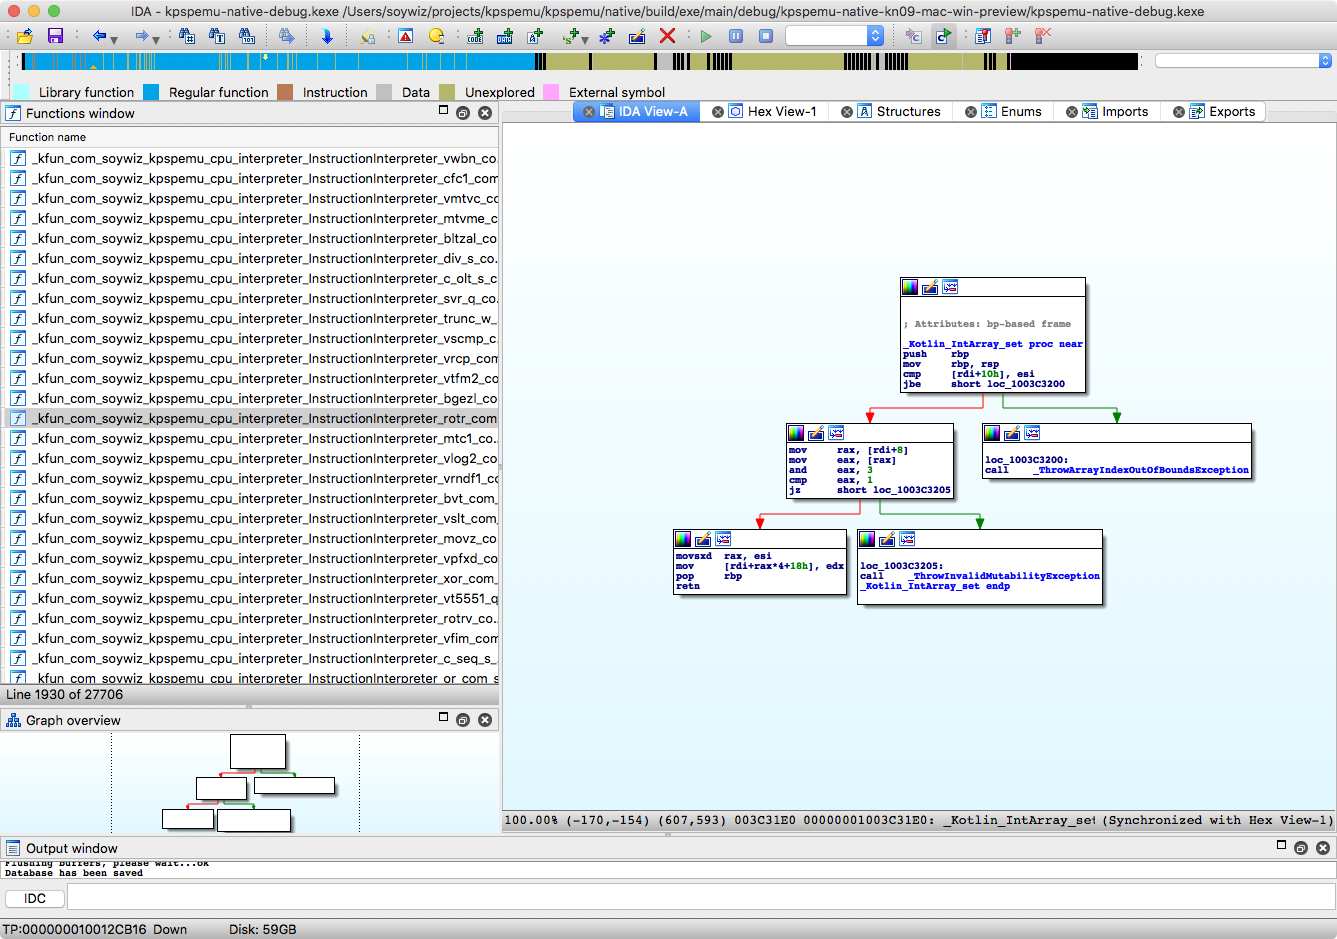
IDA Freeware version: https://www.hex-rays.com/products/ida/support/download_freeware.shtml
Reference counting
In the emulator, there is a instruction decoding, done by a dispatcher:
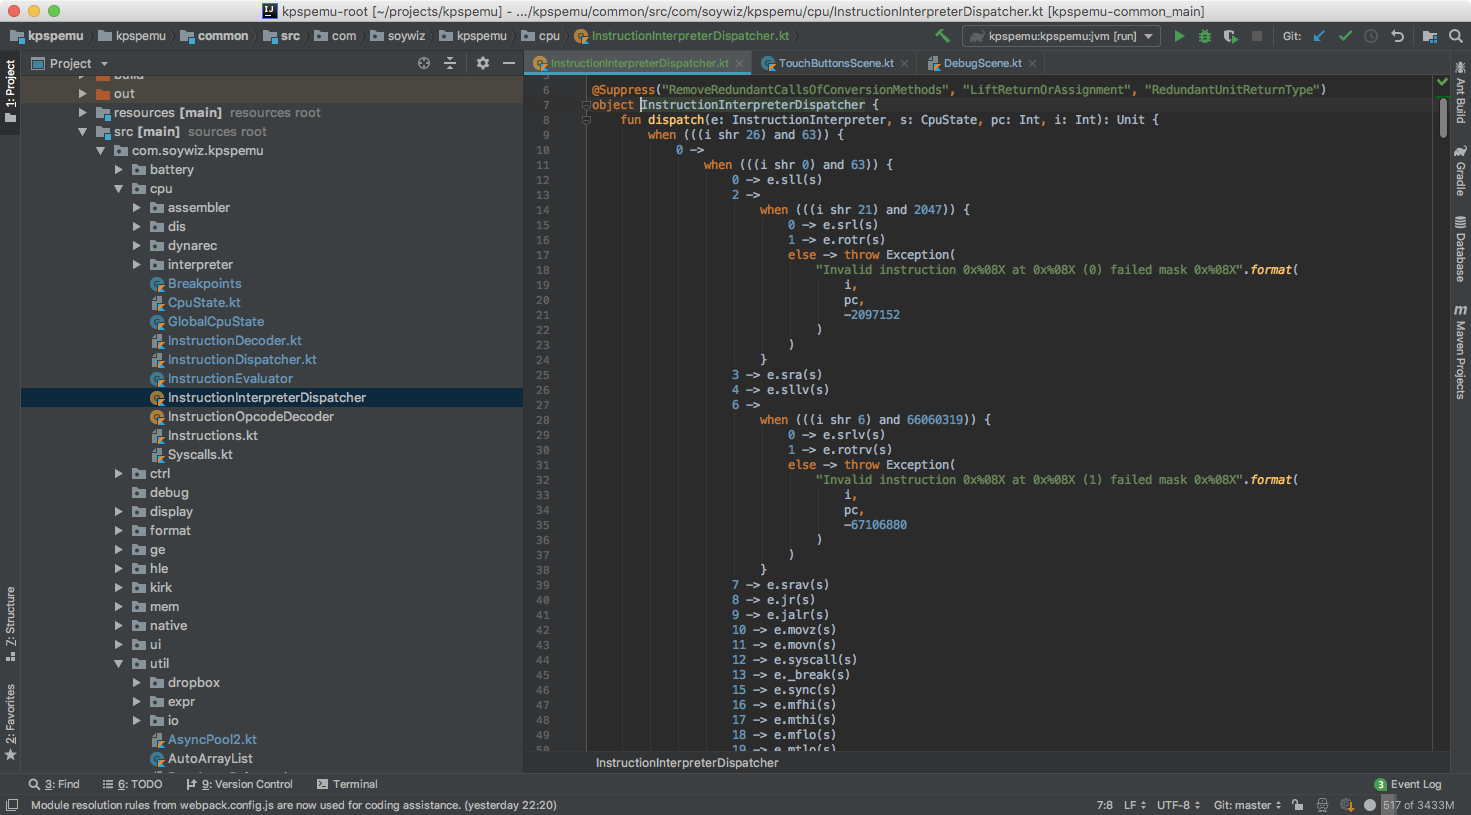
And then a instruction interpreter that includes a DSL that looks like this:
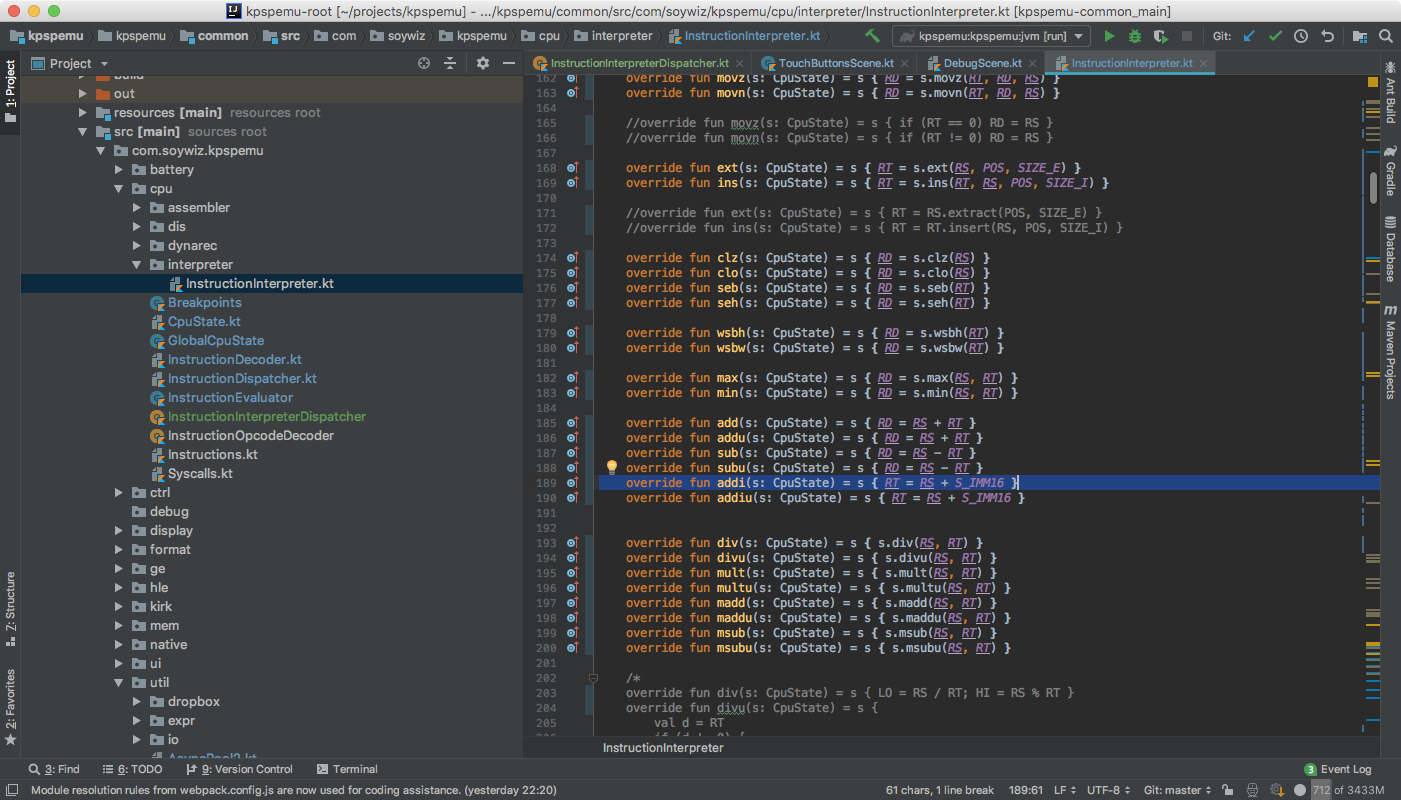
That DSL is inlined so the generated code looks like this:
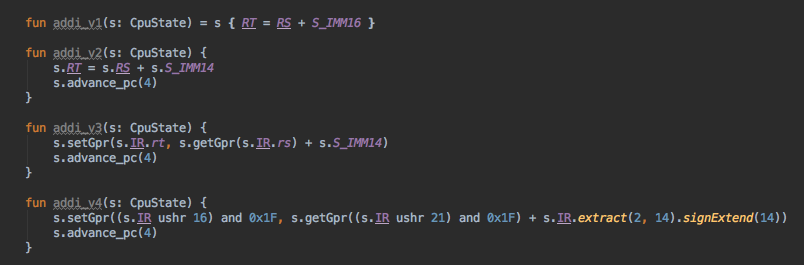
That shows how powerful are Kotlin typed DSLs + inline methods.
And a simplified version of the CpuState with the referenced methods and properties:
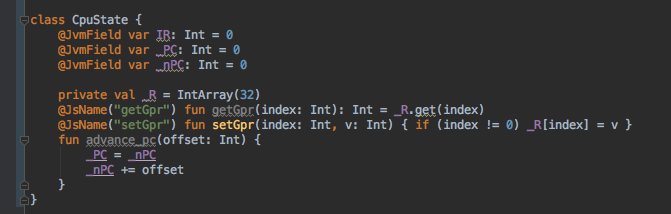
One would think that except for the bound checking and freeze overhead, there shouldn't be any other overheads. But in facts here is the hugest overhead I have found. Every time any non-primitive property is accessed even from this:
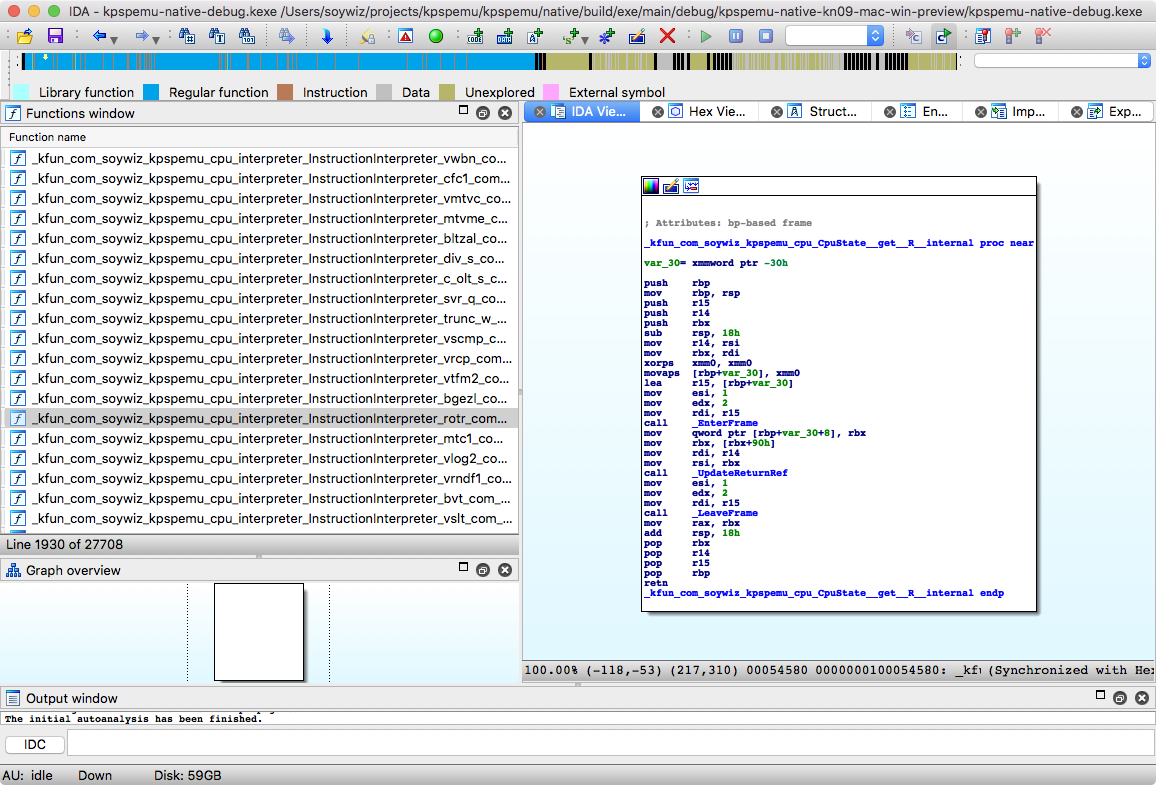
The UpdateReturnRef:

The LeaveFrame:
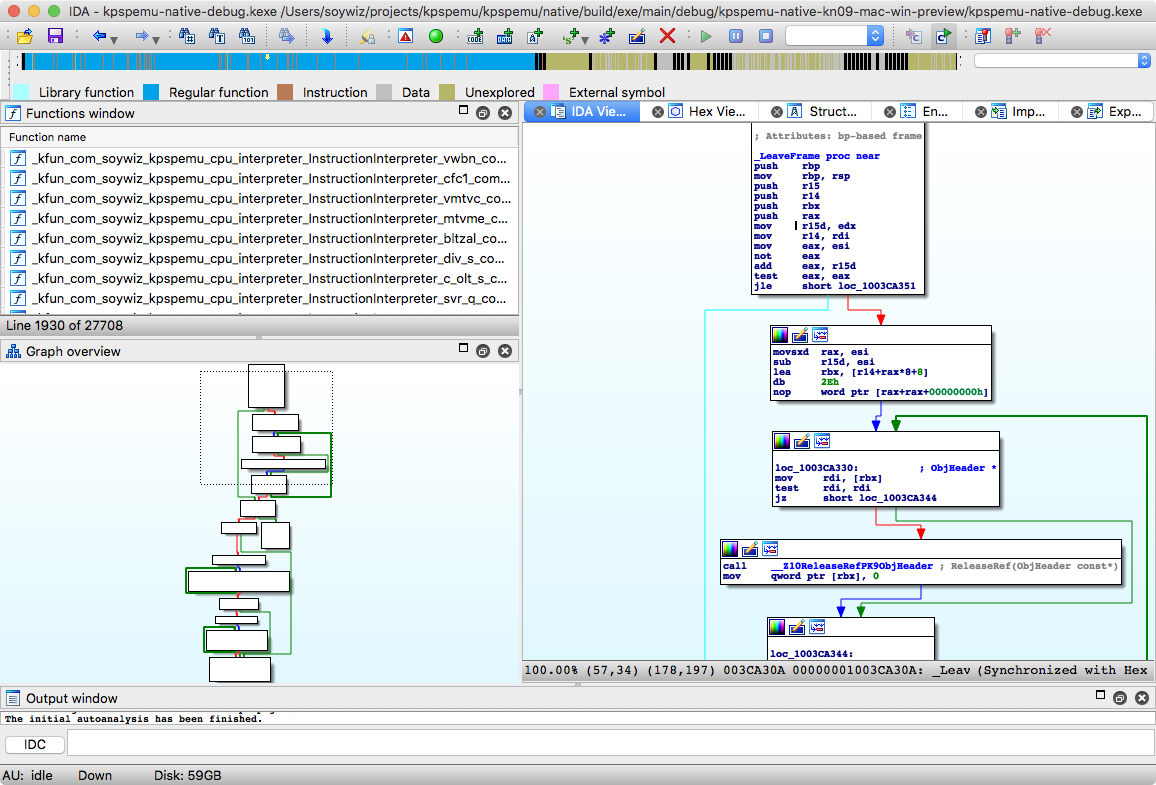
That's a lot of code everytime I access an array for example inside the CpuState. And it happens that for normal operations like an ADD rt, rs, rd, I do it like billions of times per second.
This doesn't happen for parameters, so if I would pass the _R array as a parameter. I wouldn't have this huge overhead. But that would make the code less clean. And it happens that optimizations can get rid of this issue.
Consider the following example:
val value = this.myinstance.prop1.prop2.prop3.prop4.value
By reference counting you would get the prop1, add reference, then the prop2... But it happens that in a sequence of a.b.c.d.e.f you will only retain the f (that might be a primitive), and also a is already in the stack and referenced so you can omit all but f, or even f if it is a non-reference type.
Note that I'm not taking into account HEAP compaction and other stuff like threading. I don't know the details, so maybe optimizing those require something else. But I bet it is possible since Swift uses reference counting and optimizes these things.
In this case the overhead comparing to Java is 10x~100x (up to 2 orders of magnitude). But this isn't the case for other programs, where I have noticed just a 2x: in the same order of magnitude.
Since this is a early version of Kotlin/Native this is not a big deal. And I'm pretty sure future version will implement all kind of optimizations, so this code will run super fast without additional changes.
Let's Kotlin!
Comments
Comments are powered by GitHub via utteranc.es.